
The beginner tip: Android development, old and new ways to find memory eating image in app code.
Each android developer knows situation when the device starts to be slower than expected. The general purpose is clear: something is using the memory intensively. The strange thing to see that the cause of all is a simple (or hidden) image in RAM. This image does not have too many pixels but consumes tens MBytes. It is unclear which app generated the image and how does it look at all. The developer may use long and boring way: reboot the device, turns some app off, then do it again., But the same result could be reached in more efficient way. There are two ways to find the problem.
The Old way to find memory eating image
Some developers prefer to develop and analyze software using the same old style. Using Android Device Manager, Eclipse Memory Analyzer Tool (MAT), HPROF Converter and the GIMP.
The next steps should be done to find the root of problem.
Step 1. Make device’s memory dump by Android Device Manager. (Screen #1)
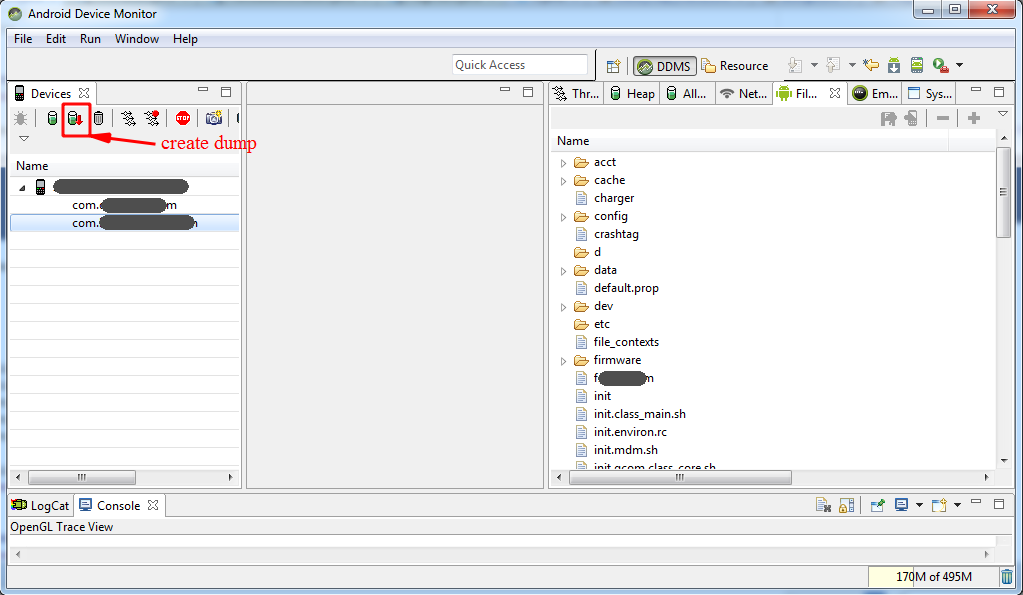
Screen #1.
Step 2. Android applications and services work on virtual machine, named Dalvic or ART (available from Android 4.4 KitKat). Heap dumps, obtained from those virtual machines are not compatible with MAT. It can work with standard JavaVM heap dumps. To avoid this inconsistency Android SDK provides console convert program. After converting the collected file to standard format, developer can view the file in a profiling tool of his choice (Screen #2).
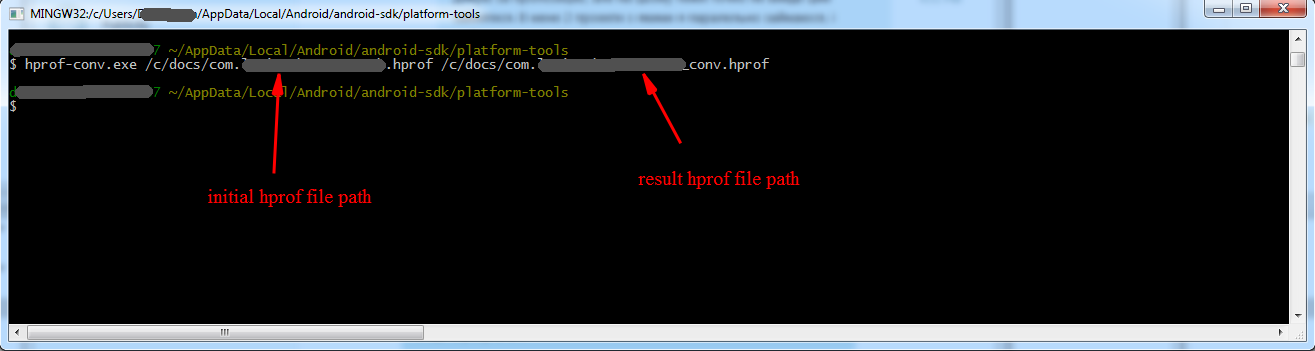
Screen #2.
Step 3. Open converted hprof-file by Eclipse Memory Analyzer, choose image file and save it as file with ‘data’ extension (Screen #3).
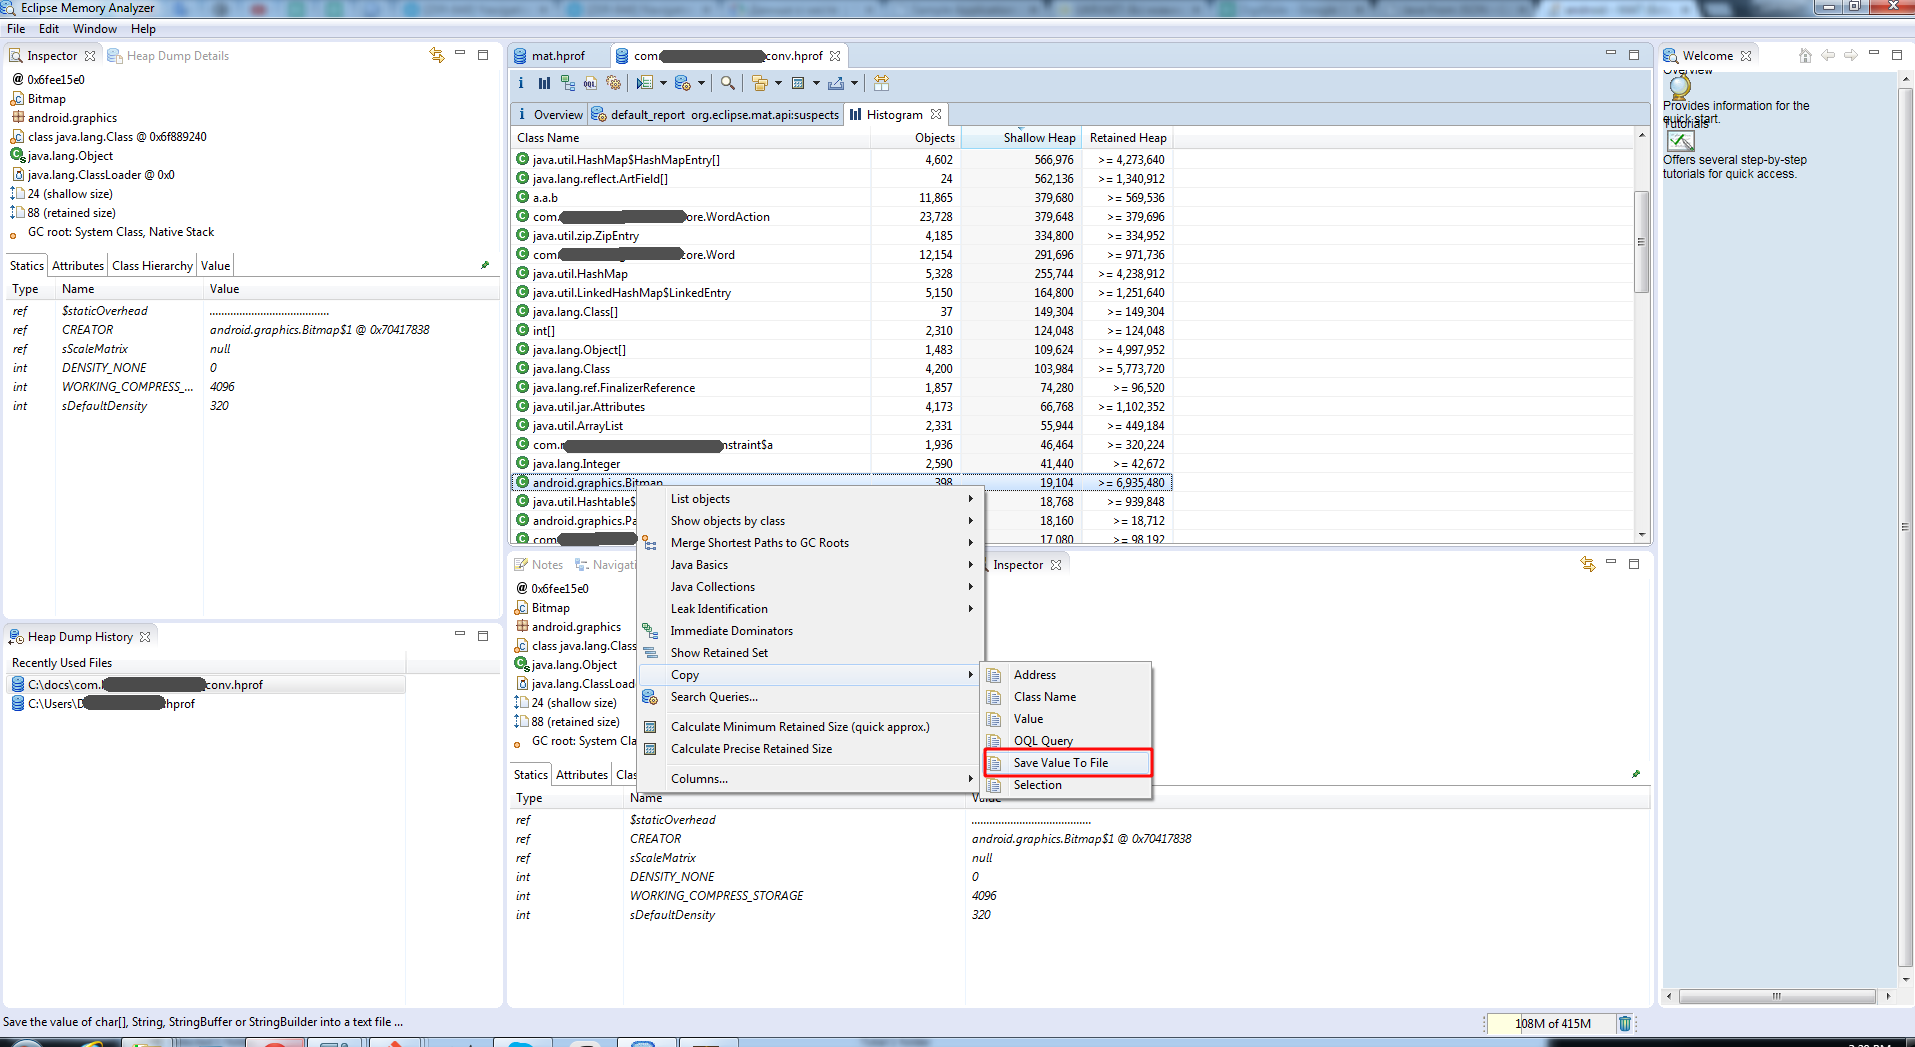
Screen #3.
Step 4. Open collected ‘data’-file by GIMP (Screen #4). Then the image editor suggests you set some options for raw image. 1) Choose ‘Image Type’ as ‘RGB Alpha’. 2) Set width and height of the image. These parameters can be found in memory dump (mWidth and mHeight fields in Eclipse Memory Analyser attribute section. Go to Window -> Show View -> MAT -> Inspector, then select an object in dominator tree).
The New way to find memory eating image
The Android Studio suggests a set of tools to find the greedy image faster.
Step 1. Open the ‘Android Monitor’ tab (at the bottom left) and then Memory tab.
Step 2. Press the ‘Dump Java Heap’ button
Step 3. Choose the ‘Bitmap’ Class Name for the current snapshot, select each Instance of bitmap and view what image exactly consumpt more memory than expected. (screens 4 and 5)
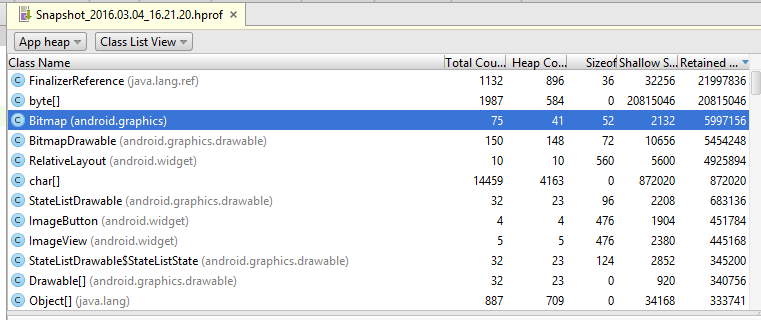
Screen #4. Choose the ‘Bitmap’ Class Name…
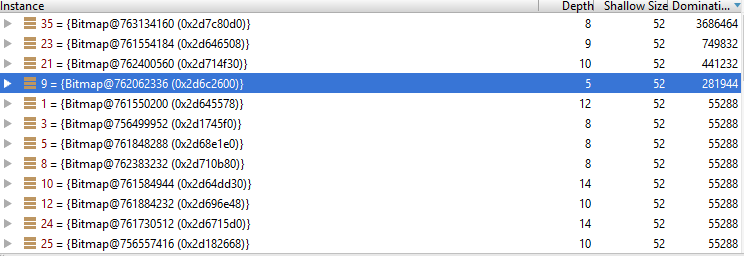
Screen #5. Select each Instance of bitmap
That’s it!
Hope these simple operations save some time for you!