Every session, your hardware generates rich behavioral signals — movement patterns, action speed, communication rhythms. For most consumer electronics companies, that data evaporates the moment the user closes the app. Here’s what happens when you decide not to let it.
1. Five Brands That Turned Device Data Into Daily Engagement Habits
None of these companies invented new hardware. They invented a new relationship with the data their hardware already captured — and turned one-time device sales into daily habits.
WHOOP
Turned biometric data into a “recovery score” you’d check every morning alongside your coffee. The strap ships free — the $30/month subscription is for the number on the screen. $3.6B valuation. Hardware as a distribution mechanism for a data product.
Strava
Didn’t invent GPS tracking. Invented social proof for physical activity. Segments, KOMs, kudos, clubs. Your Saturday 10km becomes something worth posting about. Runners don’t leave because their friends are on it, their PRs are on it, their identity is on it.
Peloton
Turned a $4,000 exercise bike into a leaderboard. Live classes, badges, streaks, high-fives mid-ride. Solo exercise became a social event. The $44/month subscription persisted even when users couldn’t afford the bike — they missed the community, not the hardware.
Apple Watch Rings
Three colored rings. No points, no prizes. But closing them every day at 11pm feels compulsive. Monthly challenges, friend competitions, award certificates. The rings alone drove three-year consecutive upgrade cycles among users who would otherwise never notice a spec bump.
“The device doesn’t change. What changes is what you do with the data it already captures.”
The pattern is identical in each case: capture passive behavioral data → surface it as insight → make it social → create a comparison loop. Once users are comparing their numbers with others, they have a reason to open your software every single day — not when they buy new hardware, not when there’s a firmware update, every day.
2. The Same Gamification Opportunity Exists in Your Device Category
Gaming peripherals — and consumer electronics more broadly — generate enormous behavioral signals that currently go nowhere. A few examples of what’s already being captured and silently discarded:
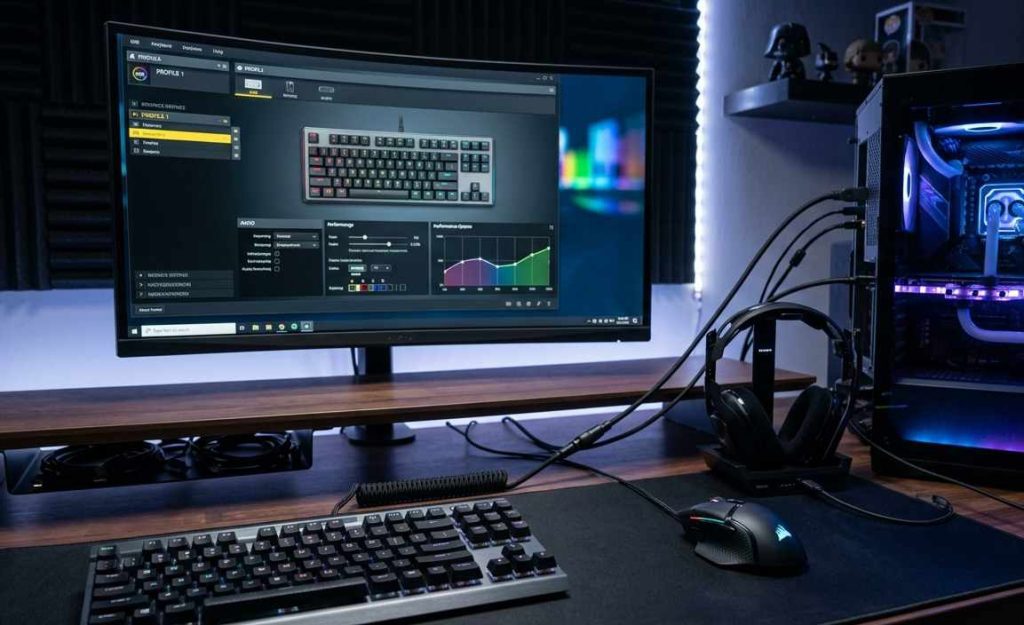
- Gaming mouse — 8,000+ position samples per second. Click force. Movement speed peaks. Direction change frequency. Session length.
- Mechanical keyboard — Keystroke counts per session. Burst typing speed. Input timing patterns. Actions per minute. Application context.
- Gaming headset — Push-to-talk frequency. Communication rhythm. Voice activity duration. Mic sensitivity adjustments over time.
- Gaming chair / desk peripherals — Posture drift over session length. Movement frequency. Sitting duration. Ergonomic event patterns.
The specific metrics surfaced to users are defined per device and shaped by product requirements — what matters for a gaming mouse is different from what matters for a fitness wearable or an audio device. The platform is built to accommodate custom signal definitions, so the stats users see reflect what’s actually meaningful for your product, not a generic template.
Your firmware already captures this. Your companion software already receives it. Right now it feeds a dashboard that users open when they want to remap a key — a utility, not a destination. What if it became a destination?
The formula is: aggregate the signal, normalize it into a legible insight, give users a way to compare that insight with others. You don’t need new hardware. You need software that treats the data like it matters.

How to Improve UX & Personalization for Gaming Peripherals →
Explore how software UX directly drives retention and brand loyalty for peripheral brands.
3. What a Device Engagement Platform Looks Like in Practice
We built a working proof of concept for this starting with gaming peripherals — specifically, tracking mouse and keyboard mechanics across gaming sessions and turning them into a social stats layer, in the same spirit as the data work behind AI-enhanced eSports analytics. We’re calling it GameStat. Here’s what the actual product looks like.
Developex is a software company that builds gamification and community engagement platforms for consumer electronics and hardware brands. We have a pre-built platform for exactly this class of application — device telemetry → aggregated insight → social comparison layer. The core framework (data pipeline, session model, feed engine, groups, privacy matrix) is complete. Adapting it to a new device category or brand typically takes 1–4 months for a working first version, compared to the year or more you’d spend building from scratch. It deploys as a standalone web product or is embedded directly inside your existing companion application, sitting alongside your current configuration tools without replacing them.
Every gaming session auto-generates a stat card — no manual logging, no in-game overlay. The desktop agent runs silently, captures aggregated mechanics data (never raw keystrokes — only counts and derived metrics), detects the hardware in use, and posts the card to the user’s feed.
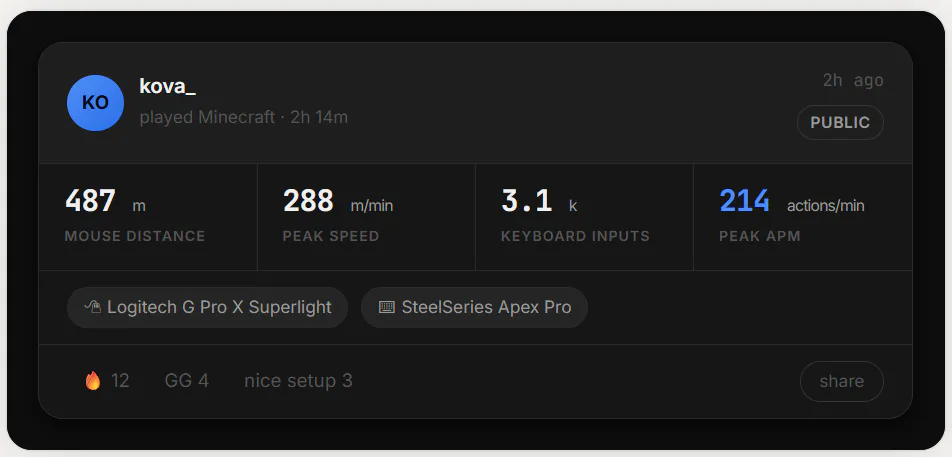
Notice what this card does: it ties the session stats directly to the hardware used. The peripheral brand isn’t a footnote — it’s part of the identity of the result. Users in hardware-specific groups (e.g. “Logitech G Pro X Superlight users”) see their peers’ cards and filter by device. The leaderboard isn’t just “best players globally” — it’s “best players using the same gear as you.”
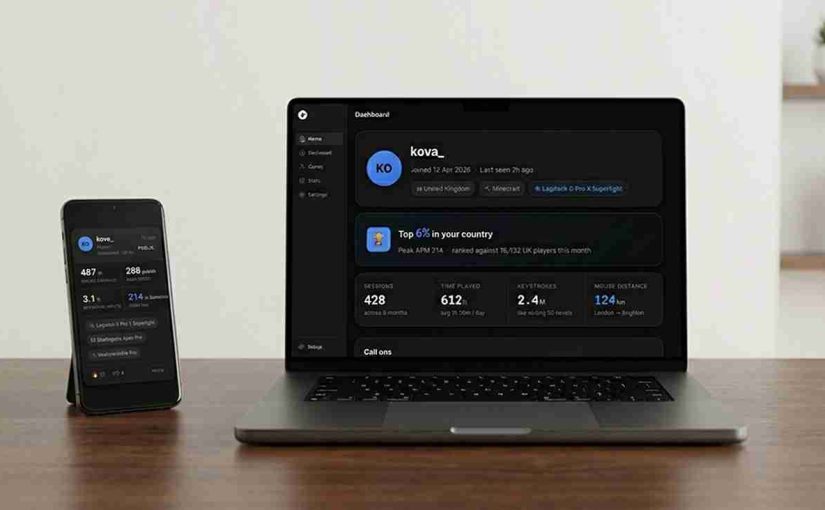
Over time, sessions accumulate into a player profile that shows standing, history, and lifetime volume.
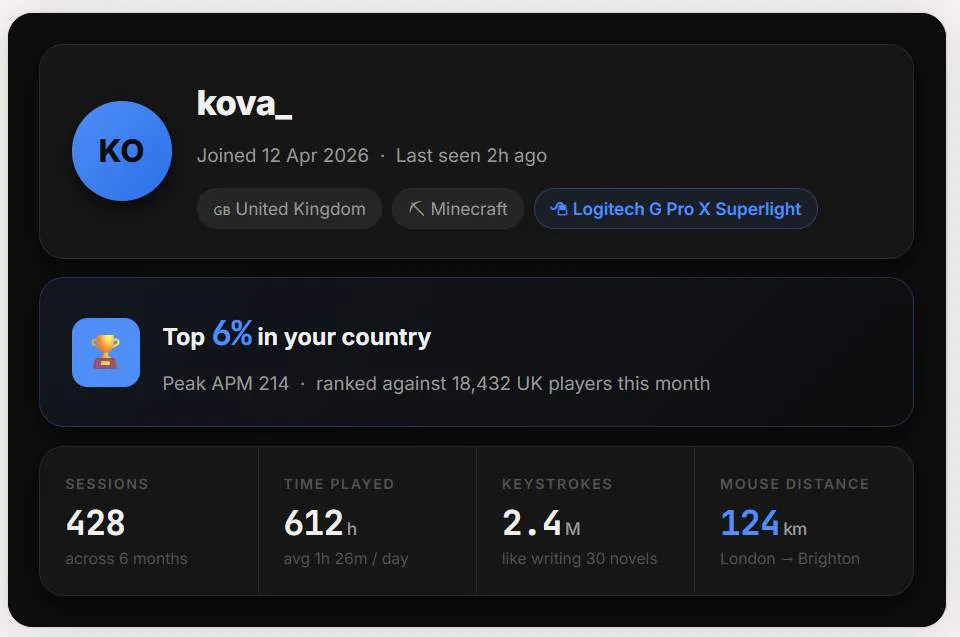
The “Top 6% in your country” line is the entire retention engine. Once a user knows they’re in the top 6% of their country for peak APM, they have a reason to come back tomorrow — to defend or improve that standing. The number doesn’t require the user to do anything extra. It’s a byproduct of sessions they were already playing.
The social layer completes the loop. Users join groups — private squads, country groups, game-specific communities — and see each other’s sessions in a shared feed, the same pattern we explored in Social Features in eGaming: From Chats to Communities. Every group gets its own stats and leaderboard:
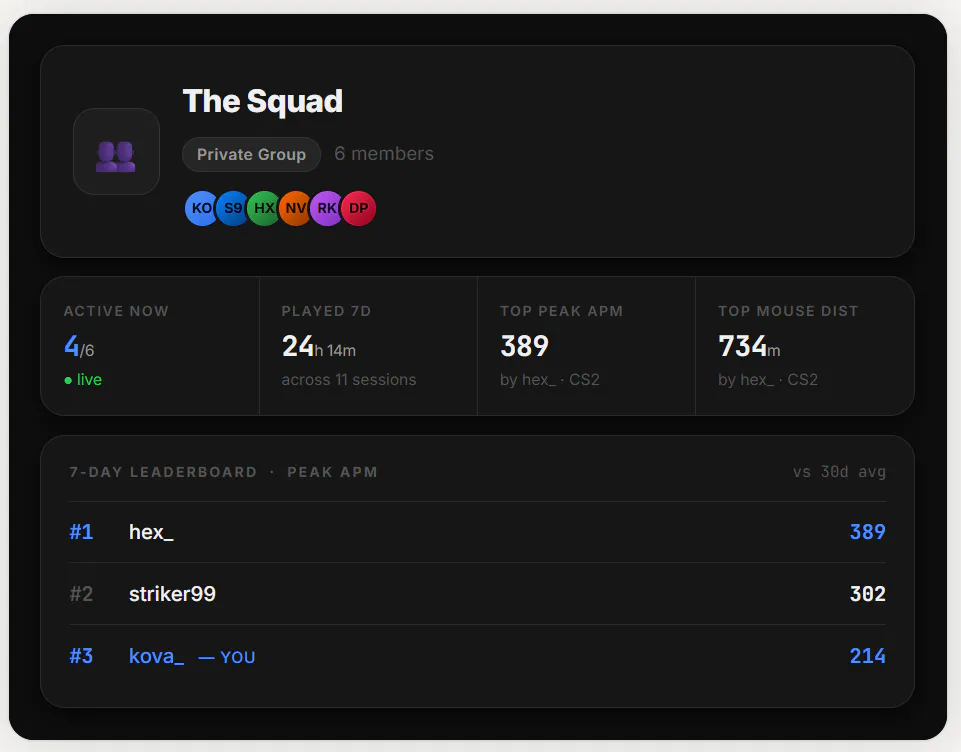
GameStat is a working proof of concept built by Developex. Every screen above is functional — session capture agent, cloud sync, feed, groups, and leaderboards. It demonstrates what this pattern looks like when applied to gaming peripherals, and is adaptable to any device category or brand.
4. Why a Hardware Retention Strategy Starts With Data, Not New Devices
Treated as a product feature, a stats layer is a nice-to-have. Treated as a platform strategy, it reshapes your entire customer relationship. The difference is whether you build it with engagement mechanics — comparison, progression, social proof — or as a passive dashboard nobody returns to.
Daily retention: Users who check their stats check your software. Not once per hardware cycle — every day. That’s a completely different relationship with your brand.
First-party data at scale Real usage patterns, game preferences, peripheral pairings, seasonal behavior — no surveys, no proxies. You stop guessing about your customers and start measuring them.
Community moat: A leaderboard of Logitech G Pro X Superlight users can’t be replicated by any other brand. It’s exclusive to your ecosystem. Users don’t leave without losing the comparison — that’s Strava’s entire retention engine. It’s also why software, not casing or color, increasingly carries a hardware brand’s identity.
New revenue models: Extended analytics, seasonal challenges, premium tiers, brand tournaments. WHOOP’s $30/month isn’t for the strap. Peloton’s $44/month isn’t for the bike. The recurring revenue is for the number on the screen.
Hardware halo effect: When your device is the instrument that shows a user they’re in the top 6% of their country, the device gains status it doesn’t have as a purchase alone. The hardware review is “this mouse made me faster.”
Upgrade acceleration: Users comparing stats within a hardware group notice when a newer device in the same ecosystem consistently yields better numbers. You created the comparison surface. You also control the hardware lineup it compares against.

Building High-ROI Communities for Consumer Electronics Brands →
Explore how community mechanics translate directly into customer lifetime value and brand loyalty.
5. No New Hardware Required: Build on Your Existing Device Ecosystem
This is worth saying plainly: none of the above requires you to ship new devices. Your current product line already captures everything you’d need. The investment is software — aggregation, analytics, visualization, and social features built on top of telemetry you’re already collecting and discarding.
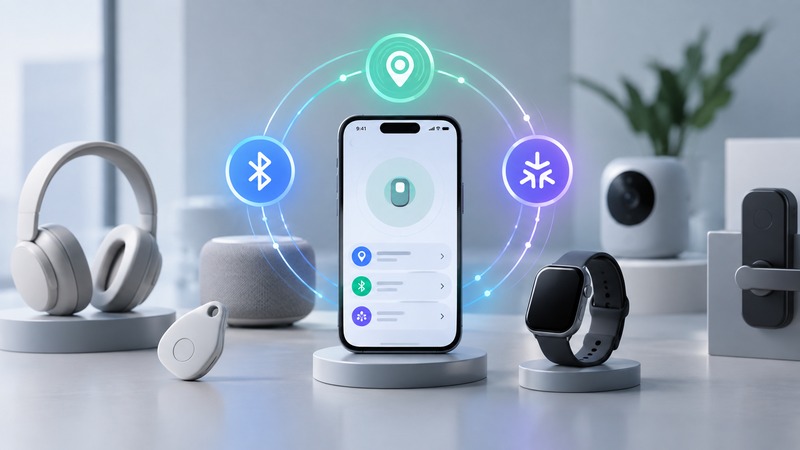
The framework is the same regardless of device category. A gaming peripheral, a fitness tracker, an audio device, a smart home product — the pattern is: what does this device passively observe about the user, how do you surface that as a number they want to own, and who can they compare that number against?
You don’t need to be Strava. You need to make your data feel like Strava makes running data feel: visible, social, and worth coming back for.
6. Frequently Asked Questions
How do we get users to open our companion app more than once a month?
The pattern that works is turning passive device data into a visible, social number. When your companion app shows users how their session performance stacks against a group of hardware peers, it creates a daily pull that configuration tools never can. Leaderboards, reaction feeds, and streaks are the mechanics — but the underlying driver is making individual data meaningful in a social context. That’s the shift from utility app to destination.
Can this be embedded in our existing companion app?
Yes. The platform ships as a standalone web product or is embedded directly inside your existing companion application. It sits alongside your current configuration and device management tools rather than replacing them.
What data does it actually capture?
Aggregated behavioral signals from connected devices: movement patterns, action frequency, session duration, hardware in use. The specific metrics are defined per device and per product requirements — what’s meaningful for a gaming peripheral differs from a fitness tracker or an audio device. Raw input data is never stored or shared — only derived metrics and counts. A per-field privacy matrix lets users control exactly what is visible and to whom.
Does this require us to ship new hardware?
No. Your current device line already captures everything the platform needs. The investment is software only — aggregation, analytics, visualization, and social features built on top of telemetry your firmware is already collecting.
Which device categories is this suitable for?
Any device that generates passive behavioral telemetry: gaming peripherals, fitness wearables, audio devices, ergonomic hardware, smart home products. The framework is device-agnostic; what changes per category is which signals are surfaced and how comparisons are framed.
What’s the difference between building this in-house and working with a specialist?
Building in-house means allocating engineering time to problems already solved: session modeling, privacy matrix design, feed architecture, group management, notification logic. A specialist brings those decisions pre-made and the edge cases already handled. In-house makes sense when the product is your core differentiator. A community engagement layer for your device line typically isn’t — but the results it produces are.
Key Takeaways
- WHOOP, Strava, and Peloton didn’t win on hardware — they won by making device data social, visible, and worth coming back for every day.
- Your firmware already captures everything you need. The gap isn’t data — it’s the software layer that turns that data into a habit.
- This pattern works across device categories: gaming peripherals, wearables, audio devices, smart home products.
- Developex built GameStat as a working proof of concept and has a reusable platform that adapts to a new brand in 1–4 months — standalone or embedded in your existing companion app.
Your hardware already captures the data. We help you turn it into user engagement.
Developex has the platform, the SDK integrations, and the engagement patterns already built. Standalone product or embedded inside your existing app — both are viable starting points. If you want to see what this looks like for your device category, let’s talk.